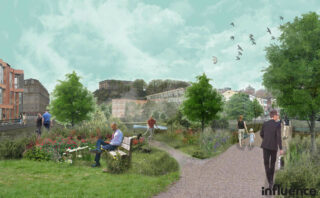
What would the regenerative city look like? We find evidence of structural changes unleashed in recent months that provide new opportunities for sustainable solutions, from sustainable and healthy buildings to electrified mobility of all shapes and sizes.

City halls are experimenting with many schemes with the goal of crafting neighbourhoods that work for communities rather than cars. This is essential to create equitable living environments. As it stands, disadvantaged communities (particularly as defined by race), lack access to many of the amenities of a sustainable city: they are less likely to have Zoom-able jobs, and their neighbourhoods have less green space but greater proximity to pollution.

Fundamental assumptions about how we live and work in cities were put to the test by COVID-19

Tourist hotspots such as Venice saw stunning improvements in environmental quality, as tourists stayed away. Cities emptied out as offices closed and people left for the suburbs and rural areas.

New York City, March 2020. Image:Reuters/Carlo Allegri/Alamy

Venice. Image:DVrcan/Getty

Spotlight topics

Some even question if the long-term trend towards urban living will endure

Before the pandemic, urban populations were growing rapidly. But cities have emptied out in the pandemic. Will people return?

Figure 149: Share of population living in cities, by country-income level, 1960-2019
Share
196019701980199020002010010%20%30%40%50%60%70%80%90%100%
Low-income
Middle-income
High-income
Pre-pandemic baseline=100
Feb 2020Mar 2020Apr 2020May 2020Jun 2020Jul 2020Aug 20200102030405060708090100110
City centre
National average
City region

Baseline is average for same day of week, Jan 3rd to Feb 6th, 2020

Spotlight topics

In many countries, cities were hit especially hard by the pandemic
Change from pre-pandemic baseline
Q2/2020Q3/2020Q4/2020Q1/2021-45%-40%-35%-30%-25%-20%-15%-10%-5%05%
Paris
France ex Paris

Spotlight topics

This has been a huge opportunity for experimentation in city life and how we live and work at home

Before the pandemic about 5% of American working hours were done at home. In April-May that rose to 60%. People living in urban areas have a new appreciation of open space.

Number
20102011201220132014201520162017201820192020050100150200250300350400450
Increase relative to pre-pandemic norm
17 Feb 202018 Feb 202019 Feb 202020 Feb 202021 Feb 202022 Feb 202023 Feb 202024 Feb 202025 Feb 202026 Feb 202027 Feb 202028 Feb 202029 Feb 2020 1 Mar 2020 2 Mar 2020 3 Mar 2020 4 Mar 2020 5 Mar 2020 6 Mar 2020 7 Mar 2020 8 Mar 2020 9 Mar 202010 Mar 202011 Mar 202012 Mar 202013 Mar 202014 Mar 202015 Mar 202016 Mar 202017 Mar 202018 Mar 202019 Mar 202020 Mar 202021 Mar 202022 Mar 202023 Mar 202024 Mar 202025 Mar 202026 Mar 202027 Mar 202028 Mar 202029 Mar 202030 Mar 202031 Mar 2020 1 Apr 2020 2 Apr 2020 3 Apr 2020 4 Apr 2020 5 Apr 2020 6 Apr 2020 7 Apr 2020 8 Apr 2020 9 Apr 202010 Apr 202011 Apr 202012 Apr 202013 Apr 202014 Apr 202015 Apr 202016 Apr 202017 Apr 202018 Apr 202019 Apr 202020 Apr 202021 Apr 202022 Apr 202023 Apr 202024 Apr 202025 Apr 202026 Apr 202027 Apr 202028 Apr 202029 Apr 202030 Apr 2020 1 May 2020 2 May 2020 3 May 2020 4 May 2020 5 May 2020 6 May 2020 7 May 2020 8 May 2020 9 May 202010 May 202011 May 202012 May 202013 May 202014 May 202015 May 202016 May 202017 May 202018 May 202019 May 202020 May 202021 May 202022 May 202023 May 202024 May 202025 May 202026 May 202027 May 202028 May 202029 May 202030 May 202031 May 2020 1 Jun 2020 2 Jun 2020 3 Jun 2020 4 Jun 2020 5 Jun 2020 6 Jun 2020 7 Jun 2020 8 Jun 2020 9 Jun 202010 Jun 202011 Jun 202012 Jun 202013 Jun 202014 Jun 202015 Jun 202016 Jun 202017 Jun 202018 Jun 202019 Jun 202020 Jun 202021 Jun 202022 Jun 202023 Jun 202024 Jun 202025 Jun 202026 Jun 202027 Jun 202028 Jun 202029 Jun 202030 Jun 2020 1 Jul 2020 2 Jul 2020 3 Jul 2020 4 Jul 2020 5 Jul 2020 6 Jul 2020 7 Jul 2020 8 Jul 2020 9 Jul 202010 Jul 202011 Jul 202012 Jul 202013 Jul 202014 Jul 202015 Jul 202016 Jul 202017 Jul 202018 Jul 202019 Jul 202020 Jul 202021 Jul 202022 Jul 202023 Jul 202024 Jul 202025 Jul 202026 Jul 202027 Jul 202028 Jul 202029 Jul 202030 Jul 202031 Jul 2020 1 Aug 2020 2 Aug 2020 3 Aug 2020 4 Aug 2020 5 Aug 2020 6 Aug 2020 7 Aug 2020 8 Aug 2020 9 Aug 202010 Aug 202011 Aug 202012 Aug 202013 Aug 202014 Aug 202015 Aug 202016 Aug 202017 Aug 202018 Aug 202019 Aug 202020 Aug 202021 Aug 202022 Aug 202023 Aug 202024 Aug 202025 Aug 202026 Aug 202027 Aug 202028 Aug 202029 Aug 202030 Aug 202031 Aug 2020 1 Sep 2020 2 Sep 2020 3 Sep 2020 4 Sep 2020 5 Sep 2020 6 Sep 2020 7 Sep 2020 8 Sep 2020 9 Sep 202010 Sep 202011 Sep 202012 Sep 202013 Sep 202014 Sep 202015 Sep 202016 Sep 202017 Sep 202018 Sep 202019 Sep 202020 Sep 202021 Sep 202022 Sep 202023 Sep 202024 Sep 202025 Sep 202026 Sep 202027 Sep 202028 Sep 202029 Sep 202030 Sep 2020 1 Oct 2020 2 Oct 2020 3 Oct 2020 4 Oct 2020 5 Oct 2020 6 Oct 2020 7 Oct 2020 8 Oct 2020 9 Oct 202010 Oct 202011 Oct 202012 Oct 202013 Oct 202014 Oct 202015 Oct 202016 Oct 202017 Oct 202018 Oct 202019 Oct 202020 Oct 202021 Oct 202022 Oct 202023 Oct 202024 Oct 202025 Oct 202026 Oct 202027 Oct 202028 Oct 202029 Oct 202030 Oct 202031 Oct 2020 1 Nov 2020 2 Nov 2020 3 Nov 2020 4 Nov 2020 5 Nov 2020 6 Nov 2020 7 Nov 2020 8 Nov 2020 9 Nov 202010 Nov 202011 Nov 202012 Nov 202013 Nov 202014 Nov 202015 Nov 202016 Nov 202017 Nov 202018 Nov 202019 Nov 202020 Nov 202021 Nov 202022 Nov 202023 Nov 202024 Nov 202025 Nov 202026 Nov 202027 Nov 202028 Nov 202029 Nov 202030 Nov 2020 1 Dec 2020 2 Dec 2020 3 Dec 2020 4 Dec 2020 5 Dec 2020 6 Dec 2020 7 Dec 2020 8 Dec 2020 9 Dec 202010 Dec 202011 Dec 202012 Dec 202013 Dec 202014 Dec 202015 Dec 202016 Dec 202017 Dec 202018 Dec 202019 Dec 202020 Dec 202021 Dec 202022 Dec 202023 Dec 202024 Dec 202025 Dec 202026 Dec 202027 Dec 202028 Dec 202029 Dec 202030 Dec 202031 Dec 2020 1 Jan 2021 2 Jan 2021 3 Jan 2021 4 Jan 2021 5 Jan 2021 6 Jan 2021 7 Jan 2021 8 Jan 2021 9 Jan 202110 Jan 202111 Jan 202112 Jan 202113 Jan 202114 Jan 202115 Jan 202116 Jan 202117 Jan 202118 Jan 202119 Jan 202120 Jan 202121 Jan 202122 Jan 202123 Jan 202124 Jan 202125 Jan 202126 Jan 202127 Jan 202128 Jan 202129 Jan 202130 Jan 202131 Jan 2021 1 Feb 2021 2 Feb 2021 3 Feb 2021 4 Feb 2021 5 Feb 2021 6 Feb 2021 7 Feb 2021 8 Feb 2021 9 Feb 202110 Feb 202111 Feb 202112 Feb 202113 Feb 202114 Feb 202115 Feb 202116 Feb 202117 Feb 202118 Feb 202119 Feb 202120 Feb 202121 Feb 202122 Feb 202123 Feb 202124 Feb 202125 Feb 202126 Feb 202127 Feb 202128 Feb 2021 1 Mar 2021 2 Mar 2021 3 Mar 2021 4 Mar 2021 5 Mar 2021 6 Mar 2021 7 Mar 2021 8 Mar 2021 9 Mar 202110 Mar 202111 Mar 202112 Mar 202113 Mar 202114 Mar 202115 Mar 202116 Mar 202117 Mar 202118 Mar 202119 Mar 202120 Mar 202121 Mar 202122 Mar 202123 Mar 202124 Mar 202125 Mar 202126 Mar 202127 Mar 202128 Mar 202129 Mar 202130 Mar 202131 Mar 2021 1 Apr 2021 2 Apr 2021 3 Apr 2021 4 Apr 2021 5 Apr 2021 6 Apr 2021 7 Apr 2021 8 Apr 2021 9 Apr 202110 Apr 202111 Apr 202112 Apr 202113 Apr 202114 Apr 202115 Apr 202116 Apr 202117 Apr 202118 Apr 202119 Apr 202120 Apr 202121 Apr 202122 Apr 202123 Apr 202124 Apr 202125 Apr 202126 Apr 202127 Apr 202128 Apr 202129 Apr 202130 Apr 2021 1 May 2021 2 May 2021 3 May 2021 4 May 2021 5 May 2021 6 May 2021 7 May 2021 8 May 2021 9 May 202110 May 202111 May 202112 May 202113 May 202114 May 202115 May 202116 May 202117 May 202118 May 202119 May 202120 May 202121 May 202122 May 202123 May 202124 May 202125 May 202126 May 202127 May 202128 May 202129 May 2021-40%-30%-20%-10%010%20%30%40%50%60%70%

Spotlight topics

With big changes in residential property markets

Rents in city centres fell sharply, even as rents in rural and suburban areas have performed strongly. People are spending more time at home.

Normalised observed rental index: 02/01/2020 = 100
Jan 2019Feb 2019Mar 2019Apr 2019May 2019Jun 2019Jul 2019Aug 2019Sep 2019Oct 2019Nov 2019Dec 2019Jan 2020Feb 2020Mar 2020Apr 2020May 2020Jun 2020Jul 2020Aug 2020Sep 2020Oct 2020Nov 2020Dec 202086889092949698100102104
Low
Mid
High
CBD
Change vs baseline
FebMarAprMayJunJulAugSepOct02%4%6%8%10%12%14%16%18%20%

Spotlight topics

The pandemic has also turned transport upside down

The early period in the pandemic saw big shifts in transport use. The changes are now less stark, but it is unclear if some changes will persist long term. The World Bank argues that COVID-19 has created new momentum for cycling and walking. The evidence from Britain shows that this is clearly true.

Annual change in passengers vs 2019, 7 day rolling average
Mar 2020Apr 2020May 2020Jun 2020Jul 2020Aug 2020Sep 2020Oct 2020Nov 2020-100%-90%-80%-70%-60%-50%-40%-30%-20%-10%010%
Subway
Bus
Long Island Rail Road
Usage relative to pre-COVID-19
Apr 2020May 2020Jun 2020Jul 2020Aug 2020Sep 2020Oct 2020Nov 2020Dec 2020Jan 2021Feb 2021Mar 2021Apr 2021May 2021050%100%150%200%250%300%350%400%
Cycling
Cars
National Rail
Transport for London Tube

Spotlight topics

The pandemic has brought home the importance of air quality to people’s health and wellbeing
Figure 158: NO₂ concentrations and mortality from COVID-19, Italian and Spanish regions, 2020
Mean deaths per region
Share of total deaths
0-5050-100100-300050100150200250300350400010%20%30%40%50%60%70%80%
Nitrogen dioxide concentration (µg/m3)
Deaths (% from all regions)
Deaths (mean per region)

Higher historical PM2.5 exposures are positively associated with higher county-level COVID-19 mortality rates

Science, November 2020

Spotlight topics

Switching to electric vehicles would have huge health benefits globally

Large-scale adoption of zero-emission vehicles could reduce deaths by many thousands a year, as well as making a critical contribution to climate goals.

Figure 159: Annual reductions in negative health outcomes from 100% medium- and heavy-duty ZEV sales by 2040, US
Deaths or visits per year
20302040205002004006008001,0001,2001,4001,6001,8002,0002,2002,4002,6002,800
Premature mortality
Emergency-room visits

Vehicle tailpipe emissions were linked to around 361,000 premature deaths from ambient PM2.5 and ozone worldwide in 2015.

International Council on Clean Transportation, 2019

Spotlight topics

What would a regenerative, net-zero city look like?

A post-COVID-19 wildscape to replace a shopping mall in Nottingham, UK, as proposed by the Wildlife Trust. Image credit: influence

Spotlight topics

The idea of the “15-minute city” has taken hold, but there is a long way to go

Paris Mayor Anne Hidalgo put the 15-minute city at the centre of her 2020 election campaign. In the past year, many cities have rolled out plans to make neighbourhoods more liveable and put people, rather than cars, at the centre.

Urban density makes walking a much easier choice for people. There is, however, wide variation in people’s access to amenities across different cities.

CityTime
London24min
Berlin16min
Paris16min
Madrid13min
Milan13min

Residents of London, Paris, Madrid, Berlin and Milan were asked how far they had to travel to green space, a shop that sells groceries, a medical facility, a school, a restaurant or café, and a leisure centre or gym.

Spotlight topics

Bike lanes and traffic calming are proliferating across Europe

Over 2500km of new cycling routes and low traffic neighbourhood schemes have been announced in Europe since the pandemic began. 1500km of these have now been implemented.

Many of these schemes also incorporate rewilding (such as adding trees and plants and encouraging biodiversity) and have other objectives like enabling children to walk to school safely.

km
Mar 2020Apr 2020May 2020Jun 2020Jul 2020Aug 2020Sep 2020Oct 2020Nov 2020Dec 2020Jan 2021Feb 2021Mar 2021Apr 202102004006008001,0001,2001,4001,6001,8002,0002,2002,4002,600
km announced
km implemented

Spotlight topics

Walkable cities are also more economically valuable

In some cities, areas where walking is easier have seen prices grow faster. However, the pandemic has closed the gap in recent months, as some people seek to relocate to more car-dependent suburban areas.

200120022003200420052006200720082009201020112012201320142015201620172018201920202021020406080100120140160180200
Somewhat walkable suburban
Car dependent suburban
Highly walkable suburban
Highly walkable CBD

Spotlight topics

A large-scale shift to WFH could help reduce emissions in car-driving communities

While residential energy use would rise, a reduction in transport would more than offset this. This IEA home-working scenario is based on just one day of working from home, which it finds would save around 24mtCO2 per year. Further savings could arise from a more comprehensive shift to home working, and via a reduction in long-distance travel for work. However, where people are using public transport to get to work, home-working actually leads to an increase in emissions.

Figure 163: Change in global final energy consumption by fuel in the “home-working” scenario
Private transportResidentialNet change-500PJ-400PJ-300PJ-200PJ-100PJ0100PJ200PJ
Fossil fuels
electricity
other
net change

Spotlight topics

City density enables lifestyles which are less resource-intensive

Urban areas are typically much more environmentally efficient than suburban or rural ones. The higher a city’s density, the lower its emissions tend to be.

Figure 164: Relationship between population density and transport emissions, global cities, latest available data
Transport emissions per person (tCO2)
02,0004,0006,0008,00010,00012,00014,00016,00018,00020,00022,000012345678
Population density (people per square km)

Spotlight topics

Even as cities continue to evolve, we need to tackle emissions from buildings

Buildings are responsible for over a third of global GHG emissions. New types of buildings, urban layouts and a faster pace of renovation all need to be leveraged to drive emissions down to net zero. “Embodied carbon“ – the CO2 emitted in producing materials – is a key issue. The importance of embodied carbon will rise over time as we decarbonise the energy we use in buildings.

SectorShare
Industry32%
Building operations28%
Transportation23%
B'ding materials/construction11%
Other6%

Spotlight topics

Deep renovation of buildings will need to accelerate

The EU is accelerating the renovation of buildings, to achieve a wide range of social and environmental objectives: enhanced quality of life, fewer people in energy poverty, a reduction in greenhouse-gas emissions, improved material reuse and additional jobs.

Deep building renovation has big implications for solutions in the buildings space. Renovation rates need to increase by three times to align with net zero in the EU. In the UK, the deployment of heat pumps will need to ramp up more than ten times by 2030 to meet net-zero goals. Though daunting, this is well within what is technically possible.

CurrentRenovation Wave policy proposalNeeded for net zero00.511.522.53
rate of renovation, %

The aim of the Renovation Wave is to at least double renovation rates from around 1% p.a. to 2% p.a. in the next 10 years and make sure renovations lead to higher energy and resource efficiency.

Heat pump units deployed, thousands
202120222023202420252026202720282029203002004006008001,0001,2001,4001,6001,80002004006008001,0001,2001,4001,6001,800
New build deployment
Retrofit deployment
Easily achievable
Achievable at a stretch
Absolute limit

Spotlight topics

Investment activity in buildings continues to heat up
Deal volume
Deal count
201620172018201920200$1bn$2bn$3bn$4bn$5bn$6bn$7bn$8bn$9bn020406080100120140160180
Deal volume
Deal count
Businesses are investing in improving their buildings, for both environmental and health benefits

These improvements are being made for many different reasons — employee wellbeing, health, productivity and environmental concerns among them. Systems for environmental performance are the most advanced, but even these need to get much smarter.

Number
201220142016201820200100200300400500600700
Emerging
Verified

Milan, Italy. An ecological house with garden on every terrace that turns the building into a vertical wood. Image: Pierluigi Palazzi / Alamy

Figure 170: Real research, design and development (RD&D) spending on building design and envelope in the OECD, 2010-19
Spending
2010201120122013201420152016201720182019$30m$40m$50m$60m$70m$80m$90m$100m$110m$120m$130m

While sustainability rating systems for buildings have been established for nearly 20 years, systems to specifically recognise healthy buildings are much more recent arrivals to the global scene.

McArthur, J. J., and Colin Powell. “Health and wellness in commercial buildings: Systematic review of sustainable building rating systems and alignment with contemporary research.“ Building and Environment 171 (2020): 106635.

Spotlight topics

Smart design and buildings operation will play a key role

Smart technology will play a key role in the sustainable buildings revolution, from the design of buildings and choice of materials, through to the operation of the building.

As well as integrating the whole building's value chain, technology can help to optimise the role of buildings in grid management, and integrate each building into the wider urban fabric.

If we are to truly ‘build back greener’, digital technology and decarbonisation will have to be placed at the centre of every construction phase, from inception to operation.

Schneider Electric

5.3

5.3 The race to electrified mobility reaches a tipping point

Electric vehicles continue to experience rapid growth

Over the past year, electric vehicles have hit the mainstream. There are now more than 7m electric vehicles on our roads and (as a chart further down shows) they can be plugged in at over 10m charging stations.

Stock
20102011201220132014201520162017201820192020012345678
China BEV
Europe BEV
United States BEV
Other BEV

BEV = Battery Electric Vehicle.

Using a wider definition of EVs that includes Plug-in Hybrid Electric Vehicles (PHEVs), the total stock is now over 10 million

Spotlight topics

There is growing choice of electric vehicles on the market
Volkswagen GroupDaimlerBMW GroupPeugeot-Citroen-OpelJLR051015202530354045
2019
2021

* Includes plug-in hybrid and fully electric models

All types of road vehicles are shifting to electric
Share
202020302040010%20%30%40%50%60%70%80%90%100%
Buses
Passenger
Light commercial
Medium commercial
Heavy commercial
Sales of EVs have accelerated during the pandemic
Monthly sales
JanFebMarAprMayJunJulAugSepOctNovDec050,000100,000150,000200,000250,000300,000350,000400,000450,000500,000550,000600,000
2018
2019
2020
CompanyVolume
Tesla179,050
Volkswagen124,018
Renault-Nissan84,501
BMW68,503
Hyundai-Kia63,731

Spotlight topics

Installations of charging stations are soaring

In 2020 the world passed the milestone of 10m public charging stations.

Units
201120122013201420152016201720182019202001m2m3m4m5m6m7m8m9m10m11m12m13m

Spotlight topics

Battery costs are collapsing
Figure 177: Volume-weighted average pack and cell price split (2020$/kWh), 2013-20
201320142015201620172018201920200$50$100$150$200$250$300$350$400$450$500
Cost/KWh (2020$)
Cell
Pack

Spotlight topics

“Price parity” between EVs and fossil-fuel/internal combustion engine cars is imminent

Today an EV is roughly the same price as an ICE car. By the 2030s EVs will be significantly cheaper, largely due to falling battery costs.

20192020202120222023202420252026202720282029203020312032203320342035$13,000$14,000$15,000$16,000$17,000$18,000$19,000$20,000$21,000
BEV
ICE - EU compliance scenario
ICE - non compliance

Spotlight topics

Europe and China are leading the way in electrifying transport
Flow
201620172018201920200$5bn$10bn$15bn$20bn$25bn$30bn$35bn$40bn$45bn$50bn$55bn$60bn$65bn
China
Europe
US
ROW
Could electric planes take off?

Although small in scale, the number of electrical aviation developments has been growing fast.

Sweden and France are banning short-haul airplane flights where trains are available. This could help create a niche for electric planes.

Number
20092010201120122013201420152016201720182019020406080100120140160180200220
Large commercial
Regional
General aviation
Urban air mobility